Data consolidation: how to move from a spreadsheet to optimized management

The complexity of data exploitation is driving retailers to rethink their inventory and procurement management strategies. Companies are increasingly relying on data centralization tools like OMS to achieve this goal.
Data consolidation has therefore become a strategic tool to better anticipate needs and enhance supply chain performance. This article delves into concrete methods to achieve successful data consolidation.
Data consolidation for better decision-making
Essential data sources
Effective data consolidation begins with mapping out various sources. These include:
-
physical points of sale,
-
online sales platforms,
-
management systems (OMS, CRM, ERP).
Openbravo Commerce Central ensures real-time centralization of all data for retailers to facilitate this consolidation process.
Quality of collected data
Label reading errors and inconsistent data are common in retail, especially when dealing with multiple sources. To make informed decisions, companies must rely on accurate data. The quality of data must be assessed based on several criteria:
-
accuracy,
-
freshness,
-
consistency,
-
completeness.
Each cell in a data analysis table must contain actionable information. For instance, recording a product reference that doesn’t match across channels makes data consolidation ineffective.
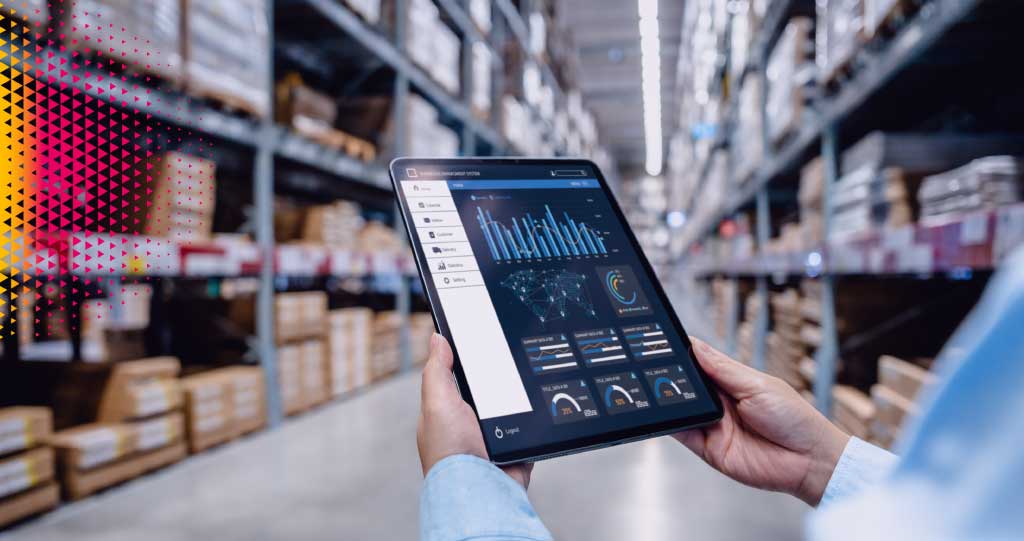
Consolidate data for optimal accessibility
For 84% of retail decision-makers, real-time access to information on stock shortages is crucial. In this context, centralizing data ensures a comprehensive view of the activity, allowing for quick responses.
With unified stock, supply chain managers can easily access relevant data and summaries. A centralized interface and dashboards facilitate faster decision-making.
Although spreadsheets and Excel sheets are widely used, Office spreadsheets with their numerous tabs, rows, and columns have limitations for efficient management. They pose risks such as errors, inefficient collaborative work, lack of user-friendliness, and no data visualization. Retailers need a consolidated view to simplify stock management across all channels.
Looking to centralize your inventory and optimize your team’s productivity? Discover our inventory and stock management solution.
Optimize supply chain management through data consolidation
Anticipate demand fluctuations
Analyzing historical data combined with variables like seasonality forms the basis of predictive models that can identify trends. To improve accuracy, these models use classic statistical formulas enhanced with advanced techniques like machine learning.
Instead of relying on static formulas, retailers incorporate dynamic models based on updated data. Choosing the right method is crucial to leverage collected information. It starts with simple calculations, such as summing sales records by product category or channel, which serve as the foundation for more advanced technical indicators.
The goal of these methods is to model scenarios to optimize replenishment through customer insights. Without data consolidation, these analyses can’t be utilized.
It is important to note that analyzing data within a narrow range can distort predictions, while evaluating a wider range allows for more representative sums and reliable trends.
Openbravo’s WMS solution helps optimize operating costs with centralized warehouse management. Request a demo of our solution!
Data consolidation for refining forecasts
Segmenting data helps companies implement a more targeted approach. By differentiating customer or product groups (by reference or category), retailers can predict demand based on specific circumstances.
This segmentation relies on behavioral indicators from CRM or online navigation. Cross-referenced with operational data, particularly by geographical area, these insights enable companies to develop more accurate forecasts.
Improving responsiveness
Integrating intelligent tools allows automation of tasks such as replenishment based on stock thresholds or redistribution among points of sale.
Openbravo SSMS enhances inventory accuracy and eliminates stock discrepancies through unified and real-time management of all retail points of sale. Discover how Openbravo SSMS can boost your productivity through automation!
The impact of decisions on the supply chain
Analysis of supplier and logistics costs
To guide their supply chain strategy, profit centers need to analyze various costs: negotiated rates, logistics expenses, indirect costs (storage, markdowns). These data are often spread across complex spreadsheets organized in multiple tabs, making them difficult to exploit. A wrong cell or erroneous calculation can skew the overall reporting. Consolidating these data into a reliable system ensures companies optimize trade-offs between cost, volume, and timeframe.
With Orisha Commerce’s Business Intelligence tools, you can easily access your data and manage your KPIs from clear dashboards where one button is enough to explore a data range.
Discover our reporting solutions!
Regular reports for performance tracking
Implementing automated reports simplifies performance indicator tracking. In a summary table, each column represents a strategic dimension of activity: product availability, supplier reliability. With a user-friendly interface, it often only takes one button to generate a report.
Adapting strategy based on results
To remain effective, a supply chain strategy must evolve based on observed results. Consulting an Excel sheet alone does not allow for effective supply chain management; it’s necessary to consider the entire process, where each entry provides an example to interpret. Results analysis begins with simple calculations (by cell or range) but quickly requires a consolidated view to identify adjustment levers.
Data consolidation is a strategic lever to enhance the performance of the supply chain. Through data consolidation, retailers can refine their forecasts and strengthen their responsiveness.
A unified strategy transforms data into a steering tool, supporting better decision-making. For supply chain teams, it is an opportunity to shift to a proactive strategy.
Frequently asked questions
How can supply chain management be improved?
To improve supply chain management, you need to:
- Centralize all data sources;
- Accurately decode demand by zone to anticipate needs;
- Track performance to adjust strategy.
How is data consolidation beneficial?
Data consolidation unifies all sources of information to provide a comprehensive view of the activity. It facilitates predictive analysis and enhances decision accuracy through tracking tables.
What does data consolidation in Excel sheets mean?
Consolidating data in Excel cells involves grouping information from multiple spreadsheets into a coherent overall view. This requires a clear column structure with standardized labels, aligning data ranges by category on organized sheets, and ensuring each Excel cell contains actionable information. An error in any one cell can skew the entire calculation.